In the retail world, there’s no merit in scoring shelf space if you’re not able to keep it. That being so, retailers often conduct category reviews, where you’re given the task of proving your product’s worth to the retailer in order to keep your product in their store.
As daunting as it might sound, a category review doesn’t have to feel like a trip to the principal’s office. The smartest brands use their reviews to actually improve their position in the store. After all, you’ve worked hard since your last formal chat with the retailer, and this is your chance to show off, prove your worth, and grab more real estate in the store. As you head into your category review, there’s one tool that’ll make your brand’s growth impossible to ignore: a data story.
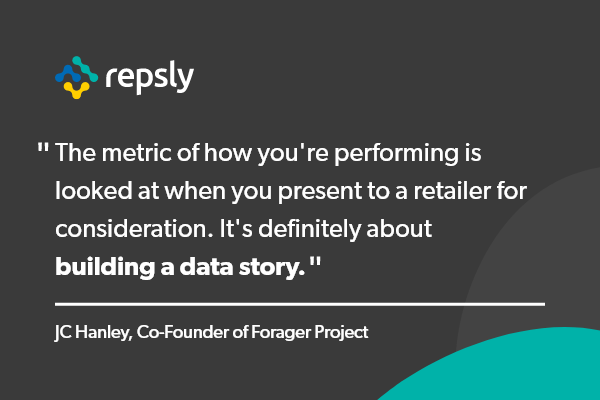
Presenting data alone, however, isn’t quite enough (I mean it’s almost 2021, everyone’s got data). But creating a data story – now that’s where the gold lies. “No matter where you are or what class of trade you started in, you’re constantly being measured [on] your velocity per SKU,” says JC Hanley, co-founder of organic and plant-based food brand Forager Project. “That metric of how you're performing is looked at the next time you present to a retailer for consideration. It's definitely about building a data story.”

The Deal With Data Stories
So what exactly is a data story? Data stories take all the analytics behind your charts and graphs and dress them up into a narrative that appeals to retailers’ hearts, not just their heads. Combining storytelling with your data gives you the power to not only show how your product is performing, but also explain the value your data provides. As the saying goes, “people hear statistics, but they feel stories.”
Data stories not only make it easier for you to present on your brand, but show preparedness and professionalism. “There's an expectation going into a category review that you'll have an understanding of your numbers,” says JC. Your data story demonstrates that understanding.
Converting Data Into Data Stories
The best way to begin outlining your story? Combine three things: narrative, data, and visuals. Your narrative gives life to your data, your data provides the facts and figures for your visuals, and your visuals make the narrative more engaging. Using those three elements, here are a few different story lines you can create:
via GIPHY
The Comparison Story
The comparison story is a great way to establish your brand’s position in the market relative to competitors. It can also be useful for providing insight on past, present, and future brand growth.
To explain your data, you’ll want to compare:
- Customer and company relationships. How’s your brand loyalty? What do consumers value about your brand over another?
- Your brand to your competition. Who’s selling more and why?
- Brand success to retailer success. Is your product selling better in one retailer compared to another because of its location in the store?
- “Then and now” situations. What kind of insight can you gain from analyzing your growth over a set period of time?
This type of data story can help you:
- Affirm your brand’s value to the retailer
- Show how your product is performing against competitors
- Advocate for priority shelf space
- Explain company growth over time
The Surprise Story
The surprise story can aid you in explaining eye-opening data insights. These insights can relate to any startling data you’ve collected, such as a recent sales flop or the success of a promotion.
To explain your data, you’ll want to look at:
- Significant spikes or falls in a set of data and what caused them. Did your sales rise because of the five demos you did last month? Or was it because you were given more shelf space?
- Landmark successes your brand has seen recently. How well did your holiday campaign resonate with buyers?
- Unexpected results collected from retail audits. Is your product selling in one retailer better than another? Did a promotion now work as well as expected?
- The effects of any recent workflow changes. Did a change in your playbook guidelines affect sales in any way?
This type of data story can help you:
- Explain any recent drawbacks your brand has experienced
- Reveal an exciting development in the growth of your brand
- Plan for the future based on unanticipated events
The Relationship Story
The relationship story can be used to explain relationships between things like increased retail sales and your velocity per SKU or how a certain promotion gave a boost to your revenue and recognition.
To explain your data, you’ll want to look at:
- Results from merchandising reports and promotional reports. How do these results relate to sales trends?
- Relationships between your product sales and retailer sales. Has the retailer experienced an increase in revenue since introducing your product to their shoppers?
- Where your product is selling quickly and why. Did that new end cap display give you a significant sales boost?
This type of data story can help you:
- Explain how a promo or new product introduction affected sales
- Highlight how working with your brand has been beneficial to retailers
- Predict brand growth for the future based on relationship data
The Importance of Quality Data
While data stories are extremely useful, your story is only good as the data behind it. The quality of your data matters, since you’re “constantly being measured” by both retailers and market researchers like Nielsen and SPINS. Category managers are used to working with data, so they can smell fudged numbers a mile away. Get hands on with your field team to make sure the data they’re collecting is consistent, so it can tell a more convincing story. Start by building a playbook to standardize your data collection process, and build a retail audit process to keep the flow of data steady.
via GIPHY
Create Playbooks and Guidelines
To make sure that your data is standardized across the board, you will want to set up guidelines to ensure your team provides the quality data you need. Create an easily accessible playbook to give teams a full grasp on what they need to do each time they visit a retailer and the best way to do it. Here’s how to make a successful playbook:
- Create mandatory task items for your team members that are specific to the rep, retailer, and/or region.
- Keep reps accountable by providing a clear timeline for when visits and tasks should be completed by.
- Develop an arsenal of best practices and preferred approaches, specific to retailer types, situations, and time of year.
- Allow the playbook to be fluid. Adapt your guidelines based on the data you’re collecting.
Conduct Retail Audits
Consider performing regular retail audits as a mode of collecting quality data. Retail audits empower you to accurately measure your success in the retail environment, and they provide a ton of data to work with. When this data is logged in real-time, you can quickly assess a situation and decide next steps. Here are just a few types of retail audits to try (as well as a checklist to get you started):
Merchandising Reports
The Goal: Measure your brand’s performance on the shelf. This can give you insight into how your products are selling, and what could be driving those sales.
- What to measure:
- Inventory levels
- Stockouts
- Condition of products
- Amount of available shelf space
- Units ordered
- Retail price
- General shelf appearance
Promotional Reports
The Goal: Measure the success of a particular promotion, and analyze what worked and what didn’t to inform future promos.
- What to measure:
- The type of promotion (tasting, demo, price reduction, etc.)
- Duration of the promotion
- Featured product SKUs
- In-store position
- Sales results
- Effectiveness of the promotion
Competitor Survey
The Goal: Measure a competing brand’s performance on the shelf. This can reveal invaluable insight into how your brand stacks up against others in its category.
- What to measure:
- Who your direct and indirect competitors are in the store
- Competitors’ pricing strategies
- How many facings competitors have on the shelf
- Where competitors’ products are located in the store
- Any promotions competitors are running
Combining quality data with storytelling is the key to demonstrating your product’s worth. This is true not just for category reviews, but for any pitch or presentation you give representing your brand. As we’ve learned, the questions are, “Why’s your product different? What’s your company about? And, what do you believe in?” The answers to those questions don’t lie in numbers alone. Anyone can look at numbers and stats, but it’s the story behind them that creates a lasting impression and provides real insight.
Explore the three types of data high-performing retail brands leverage to expand their in-store footprint and much more in this free eBook. Learn how winning CPG brands are creating powerful data stories to win more space and maximize their impact in every store.


